Viewing a Region's Statistics
From the Enterprise Server for .NET user interface, you can view the statistics for a running region.
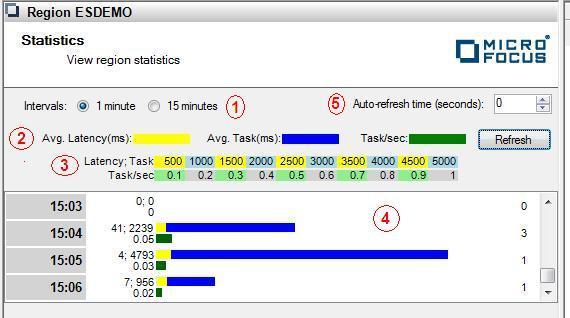
The statistics shown are the number of transactions per second, and the average transaction latency. The statistics screen displays the following information:
- Use the
Intervals radio buttons to set the statistics time length:
- Select 1 minute to display statistics on transactions that run over each one minute interval.
- Select 15 minutes to display statistics on transactions that run over each 15 minute interval.
- This area displays the color legend for the display.
- This is a ruler that shows the latency and the task per second values that the bars indicate.
- Horizontal color coded bars represent the statistic values.
- Use Auto-refresh time (seconds): field to set the number of seconds between display refreshes.