The Debug Toolbar
The default Debug toolbar is shown below:
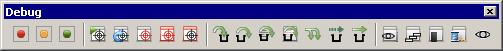
The Debug toolbar commands (looking at the toolbar illustration from left to right) are described in the following table:
| Command | Description | Menu Equivalent |
|---|---|---|
| Toggle Breakpoint | At the cursor position, sets or removes a breakpoint | Debug > Breakpoints |
| Disable Breakpoint | Disables the selected breakpoint | Debug > Breakpoints |
| Clear All Breakpoints | Removes all breakpoints from the program | Debug > Breakpoints |
| Go | Starts the selected program in the AcuBench integrated debugger | Debug > Go |
| Restart | Ends the current debugging session and begins a new session | Debug > Restart |
| Exit Debugger | Terminates the current debugger session, but leaves the debugger open | Debug > Exit Debugger |
| Quit Debugging | Terminates the debugger session and exits the debugger | Debug > Quit Debugging |
| Interrupt | Stops execution of the program, returning control to the debugger | Debug > Interrupt |
| Step Into | Steps to the next statement | Debug > Step Into |
| Step Over | Steps over the next statement | Debug > Step Over |
| Step out Paragraph | Runs the program until the current paragraph returns to the point from which it was performed | Debug > Step Out Paragraph |
| Step out Program | Runs the program until it exits to its calling program | Debug > Step Out Program |
| Auto Step | Lets you execute step commands repeatedly until the program's end | Debug > Auto Step |
| Skip to Line | Moves the current program location to the line containing the cursor | Debug > Skip To Line |
| Run to Cursor | Sets a temporary breakpoint at the current line (or closest line with a verb) and continues execution of the program | Debug > Run To Cursor |
| Watch Window | Causes the Watch window to be displayed or hidden | View > Debug Window > Watch |
| Call Stack Window | Causes the Stack Info window to be displayed or hidden | View > Debug Window > Call Stack |
| Memory Window | Causes the Memory window to be displayed or hidden | View > Debug Window > Memory |
| Threads Window | Generates the Threads dialog box | View > Debug Window > Threads |
| Quick Watch | Opens the Quick Watch window, which displays the value of a selected variable | Debug > Quick Watch |