


CodeWatch provides debugging facilities, such as stepping, setting breakpoints or tracing. You can examine the source program, find specified text strings, move to specified line numbers, and examine included source files.
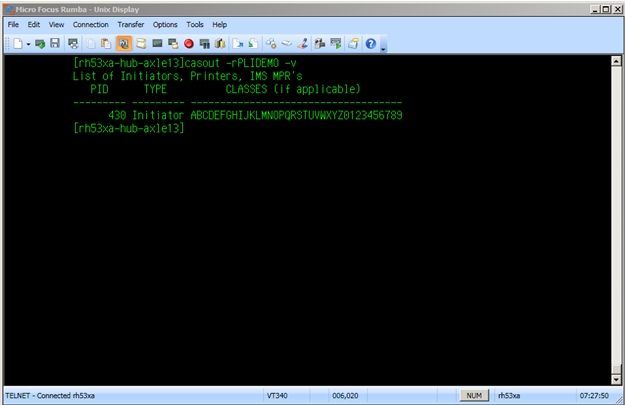
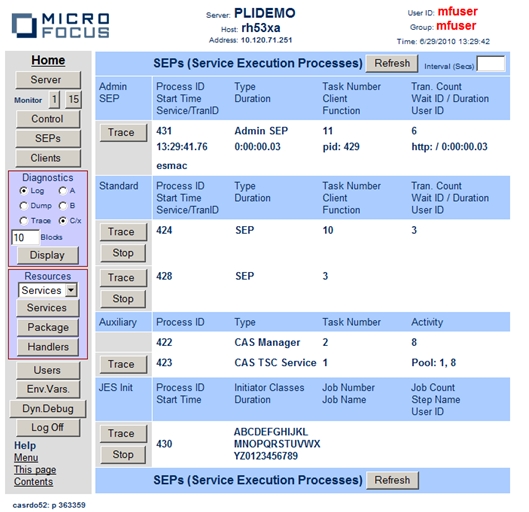
When debugging on UNIX, you are required to attach the debugger to a batch initiatior and then let it run until a setting in PLIDEBUG.DAT indicates that a SIGTRAP should be generated to interrupt the debug session. At the interrupt you can then load the symbols, set appropriate breakpoints and continue execution into your code stepping as appropriate. The first step is to determine the process ID of the batch initiator. You can do this in one of the following ways:
casout -rPLIDEMO -v
export LD_LIBRARY_PATH=/home/hub/nxopdemo/debug:$LD_LIBRARY_PATH
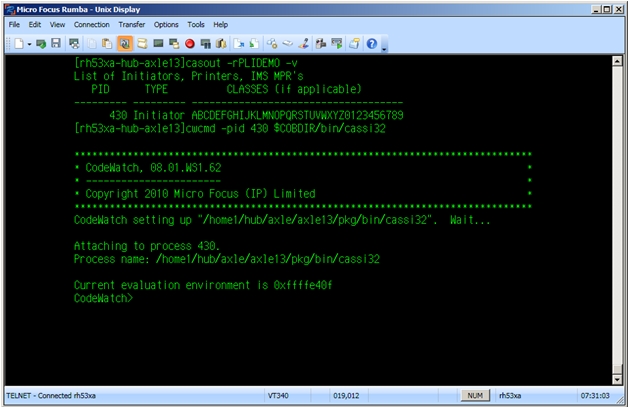
You now need to attach to your process ID which you determined in one of the two ways listed above. If, for example, your process ID is 430, you can attach to it by typing the following command in the cwcmd command prompt:
cwcmd -pid 430 $COBDIR/bin/cassi32
If you type c to continue, the batch initiator will run until SIGTRAP is triggered as a result of the setting in PLIDEBUG.DAT
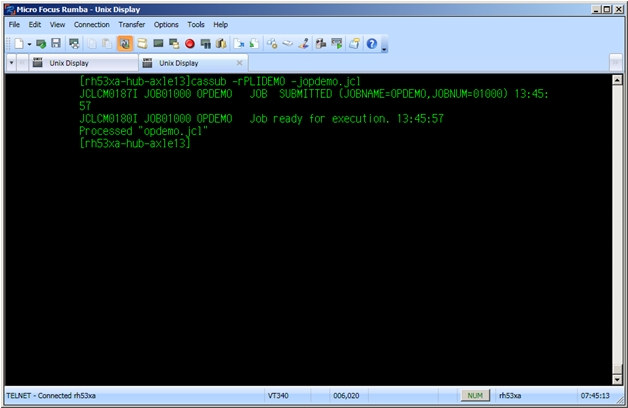
You now can submit the JCL via the ESMAC interface or via a cassub command. For the purposes ot this tutorial, use the cassub command from a second Telenet session.
If you switch back to your CodeWatch session, you can see that the SIGTRAP has occurred for OPDEMO.so. You can now issue commands to load the symbols, and set appropriate breakpoints. (eg. shlib OPDEMO.so; env OPDEMO; br %ENTRY; br %EXIT [det;q] )
If you type c to continue, you can see that you are at the entry in OPDEMO.

See the CodeWatch User's Guide for more information on debugging with CodeWatch.